Decoding Crypto Charts: Essential Tips for Beginners


Understanding the Basics of Crypto Charts
For anyone stepping into the world of cryptocurrency trading, understanding crypto charts is crucial. These charts are your gateway to making informed decisions, helping you decipher market trends and fluctuations. However, for beginners, these charts can appear complex and overwhelming. This guide aims to simplify the process, offering essential tips to help you get started.
At their core, crypto charts are visual representations of the price movements of cryptocurrencies over time. They provide traders with insights into market dynamics, allowing them to predict potential price changes. By learning to read these charts, you can gain a competitive edge in the fast-paced crypto market.

Types of Crypto Charts
There are several types of crypto charts that traders commonly use. The most popular ones include line charts, bar charts, and candlestick charts. Each type presents data in a slightly different way, offering unique insights.
- Line Charts: These are the simplest form of charts, showing the closing prices over a specified period. They are ideal for getting a quick overview of the market trend.
- Bar Charts: Bar charts provide more detailed information than line charts, including opening, closing, high, and low prices within a specific period.
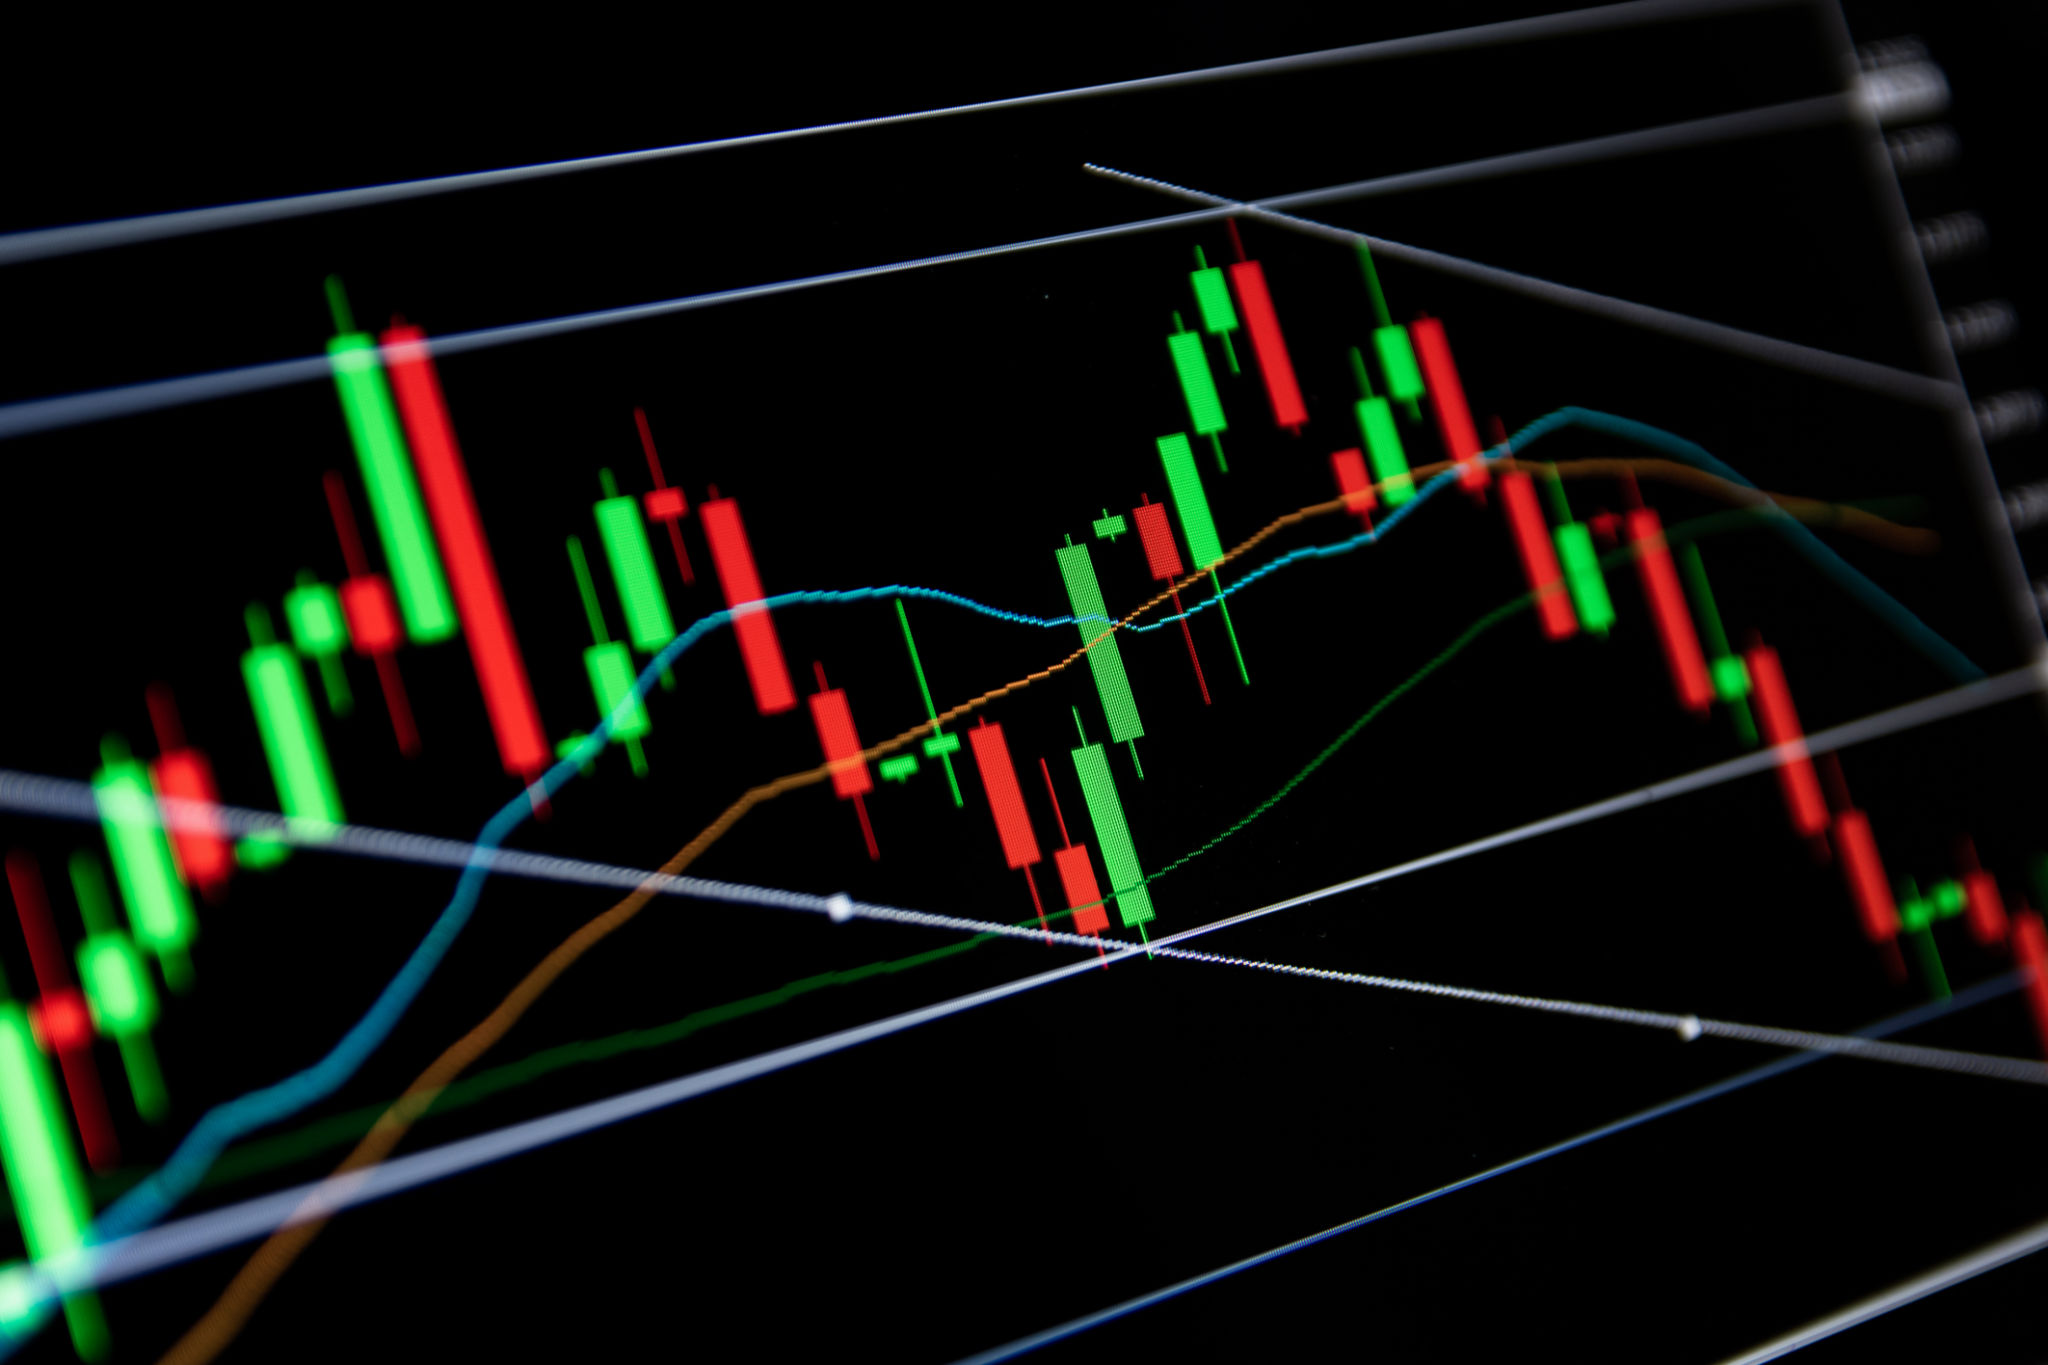
- Candlestick Charts: These charts are favored by many traders for their detailed representation of market trends, showing the same data as bar charts but in a more visually intuitive format.

Reading Candlestick Patterns
Candlestick charts are particularly valuable for identifying patterns that can indicate future price movements. Each candlestick represents a specific time frame and provides information about the opening, closing, high, and low prices. Recognizing patterns such as dojis, hammers, and engulfing patterns can help you anticipate market trends.
Doji Candlestick: A doji occurs when the opening and closing prices are nearly equal. It signals indecision in the market and can precede a reversal in trend.
Analyzing Trends and Indicators
Understanding trends is vital for successful trading. A trend indicates the overall direction in which the market is moving. Identifying whether a market is in an uptrend, downtrend, or sideways trend can help you make strategic trading decisions.
In addition to trends, traders often use technical indicators to analyze crypto charts. Some popular indicators include moving averages, Relative Strength Index (RSI), and Bollinger Bands. These tools can provide additional context about market conditions and potential price movements.
Tips for Beginners
As a beginner, it's important to start slow and gradually increase your knowledge and skills. Here are some tips to keep in mind:
- Practice with Demo Accounts: Many platforms offer demo accounts that allow you to practice trading without financial risk.
- Stay Informed: Keep up with the latest news and developments in the crypto world as they can significantly impact market movements.
- Develop a Strategy: Create a trading plan that outlines your goals, risk tolerance, and preferred trading style.
By following these tips and continuing to educate yourself on crypto chart analysis, you'll be better equipped to navigate the complexities of cryptocurrency trading. Remember, practice and patience are key components of becoming a successful trader.