How to Read Crypto Charts: A Beginner's Guide
Understanding the Basics of Crypto Charts
Reading crypto charts can seem daunting at first, but with a bit of practice, you'll be able to navigate them with ease. At their core, these charts provide a visual representation of cryptocurrency price movements over time. They are essential tools for traders and investors who want to make informed decisions.
Crypto charts typically display information such as price, volume, and time frame. The most common types of charts you'll encounter are line charts, bar charts, and candlestick charts. Each type presents data in a slightly different way, but all aim to help you understand market trends.

Types of Crypto Charts
Line Charts
Line charts are the simplest form of crypto charts and are a great starting point for beginners. They plot the closing prices of a cryptocurrency over a specified period, connecting these points with a single line. While they offer a clear picture of the general trend, they lack detailed information about intra-day price movements.
Bar Charts
Bar charts provide more detailed information compared to line charts. Each bar represents a specific time period and shows the opening, closing, high, and low prices. The top of the bar indicates the highest price, while the bottom represents the lowest price within that time frame. A small horizontal line on the left shows the opening price, and one on the right marks the closing price.

Candlestick Charts
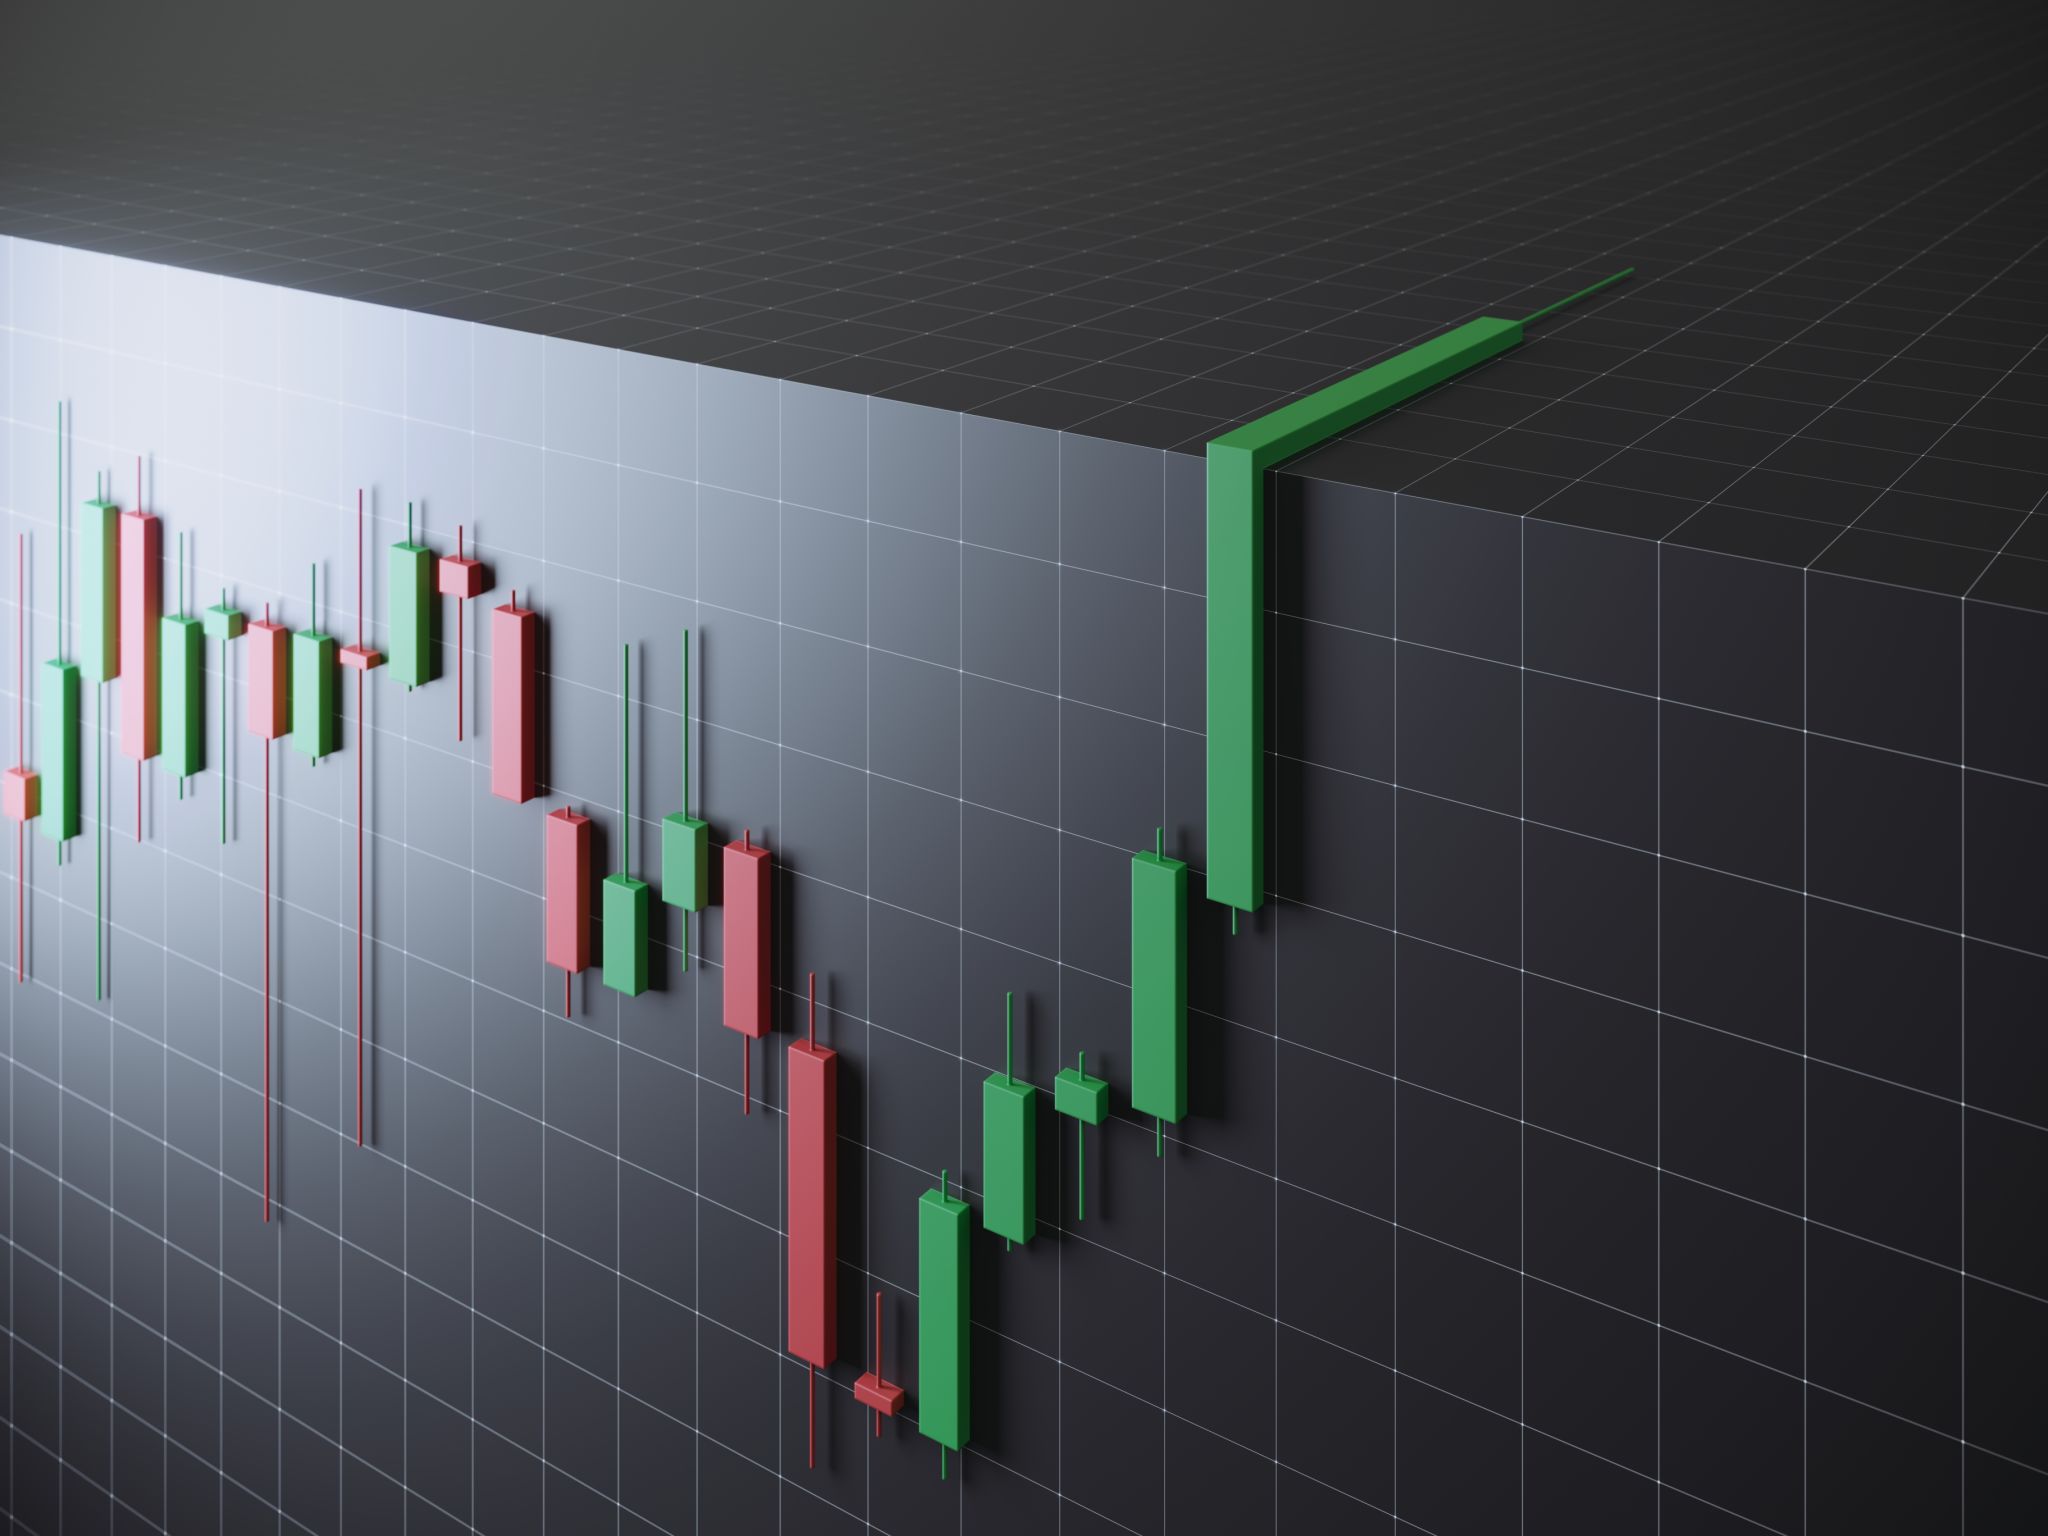
Candlestick charts are highly popular among traders due to their detailed and visually appealing representation of data. Each "candle" illustrates the opening, closing, high, and low prices for a given time period. The body of the candle shows the opening and closing prices, while the wicks (or shadows) show the high and low prices. If the closing price is higher than the opening price, the candle is usually colored green or white, indicating a bullish market. Conversely, if the closing price is lower, it is often colored red or black, indicating a bearish market.
Candlestick patterns can also provide insights into market sentiment and potential future movements. Recognizing patterns like "dojis," "hammers," or "engulfing patterns" can offer clues about potential reversals or continuations in trends.

Key Indicators to Watch
Apart from understanding chart types, being familiar with key indicators can enhance your ability to read crypto charts effectively. Indicators like Moving Averages (MA), Relative Strength Index (RSI), and Bollinger Bands are commonly used by traders.
Moving Averages (MA) are used to smooth out price data and identify trends over a period. A simple moving average (SMA) calculates the average of past prices, while exponential moving averages (EMA) give more weight to recent prices.
Relative Strength Index (RSI)
The RSI is a momentum indicator that measures the speed and change of price movements. Typically measured over a 14-day period, an RSI above 70 suggests that an asset is overbought, while an RSI below 30 indicates it might be oversold.

Putting It All Together
Reading crypto charts effectively requires practice and familiarity with various elements like chart types and indicators. Start by focusing on one chart type and gradually incorporate indicators to deepen your analysis. Keep in mind that no chart can predict future prices with absolute certainty; they provide probabilities based on historical data.
As you become more comfortable with crypto charts, you’ll be better equipped to make informed decisions in your trading or investing journey. Remember that continuous learning and adapting to new market conditions are key to success in the dynamic world of cryptocurrencies.