How to Read Crypto Charts: A Visual Guide


Understanding crypto charts is essential for anyone looking to trade or invest in cryptocurrencies. These charts provide real-time data on price movements, trading volumes, and market trends, which can help traders make informed decisions. In this guide, we'll walk you through the basics of reading crypto charts, using visual aids to simplify complex concepts.
Understanding the Basics of Crypto Charts
Crypto charts are graphical representations of how the price of a cryptocurrency changes over time. The most common type is the candlestick chart, which provides a comprehensive view of price action. Each "candlestick" shows four key data points: open, high, low, and close prices for a specific time frame.
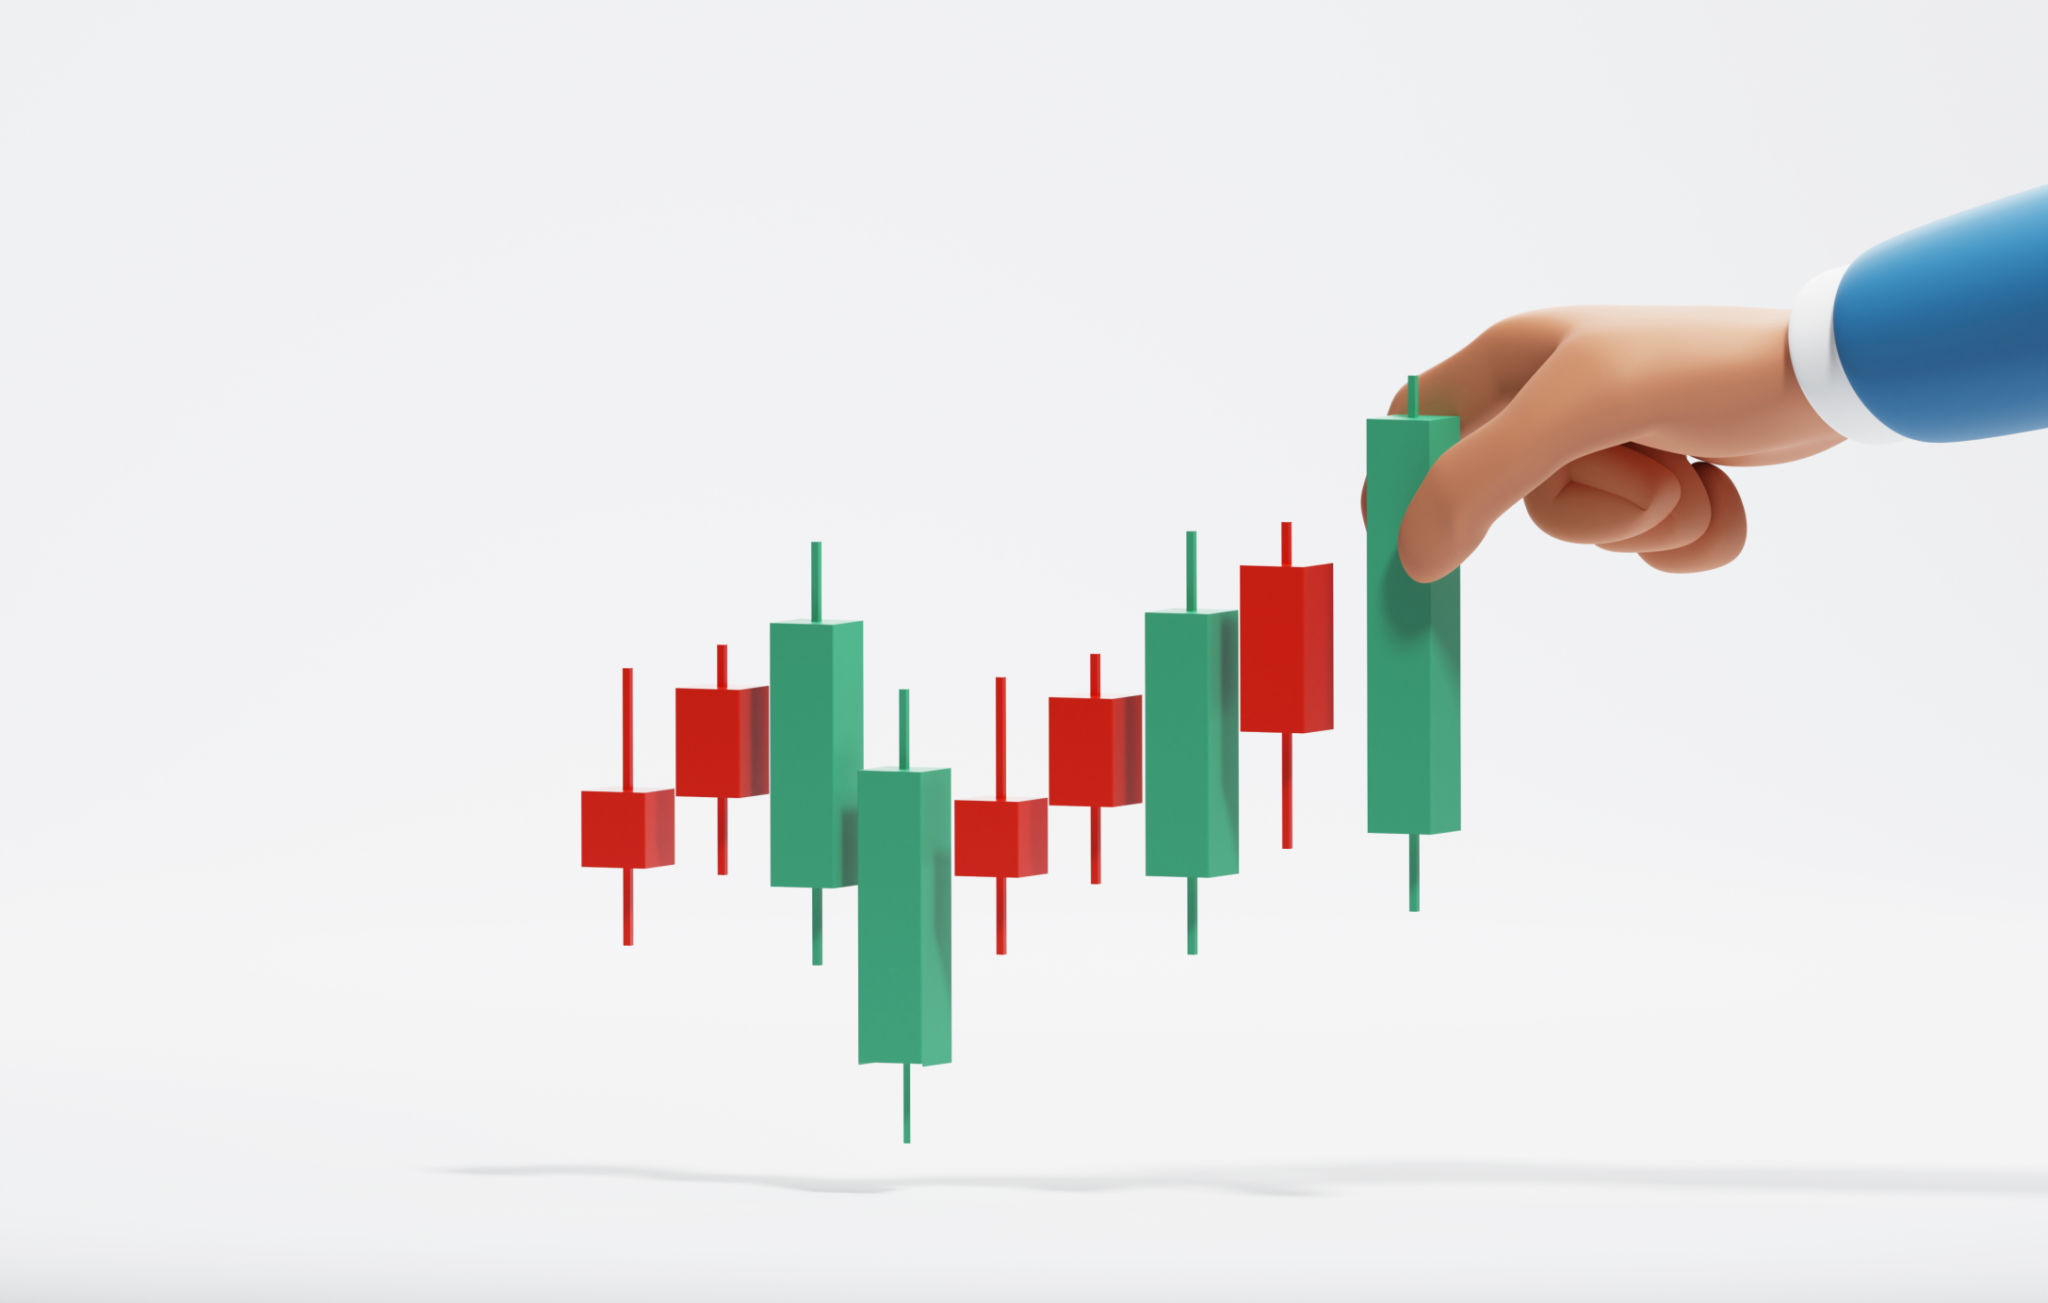
The candlestick body represents the difference between the opening and closing prices. If the close is higher than the open, the candle is typically green or white, indicating a bullish trend. Conversely, if the close is lower than the open, the candle is red or black, signaling a bearish trend.
Time Frames and Their Importance
Time frames in crypto charts can vary widely, from one minute to one month. Choosing the right time frame is crucial depending on your trading strategy. Short-term traders might focus on minute or hourly charts, while long-term investors could benefit from daily or weekly charts.
Analyzing different time frames allows traders to better understand market trends and potential price movements. For instance, a short-term uptrend on a 15-minute chart may appear as a minor blip on a daily chart.

Key Indicators to Watch
Certain indicators are vital when analyzing crypto charts. Moving averages (MA) are among the most popular, providing smooth lines that illustrate average price movements over a specific period. A simple moving average (SMA) calculates the average price over a set number of periods, while an exponential moving average (EMA) gives more weight to recent prices.
Another crucial indicator is the Relative Strength Index (RSI), which measures the speed and change of price movements. RSI values range from 0 to 100; a value above 70 indicates that an asset may be overbought, while below 30 suggests it may be oversold.

Understanding Volume
Volume is another critical component of crypto charts. It shows how much of a cryptocurrency was traded during a specific period. High volume often indicates strong investor interest and can signal potential price movements. It is also used to confirm trends; a price increase accompanied by high volume suggests a more sustainable trend.
Volume is typically represented by bar charts at the bottom of a candlestick chart. These bars provide insight into market activity and help traders assess the strength of a trend.
Support and Resistance Levels
Support and resistance levels are horizontal lines drawn on crypto charts to indicate points where prices tend to reverse direction. Support levels are where a downtrend can pause due to increased buying interest, while resistance levels occur where an uptrend may stall because of selling pressure.
Identifying these levels helps traders determine potential entry and exit points. When prices break through support or resistance levels, it may signal a continuation of the current trend.
The Importance of Trend Lines
Trend lines are diagonal lines drawn on crypto charts to connect multiple price points. They help identify the direction and strength of a trend. An upward trend line connects successive higher lows in an uptrend, while a downward trend line connects lower highs in a downtrend.
By understanding and utilizing these components, traders can better navigate the volatile crypto markets and make more informed trading decisions.